EARNINGS SUMMARY
Financial Statement Summary <Full Year>
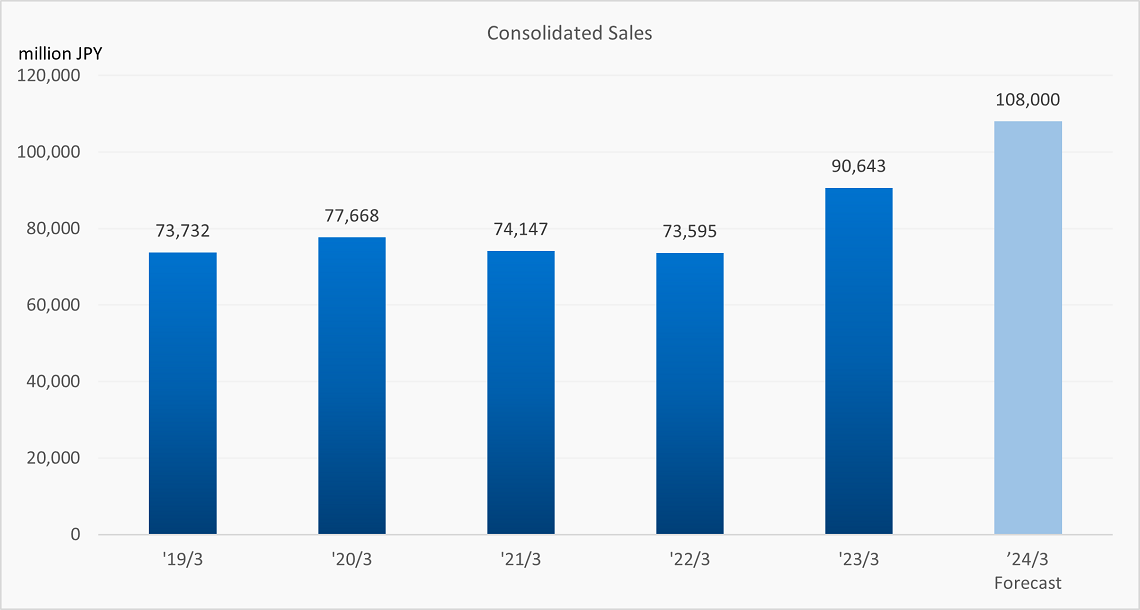
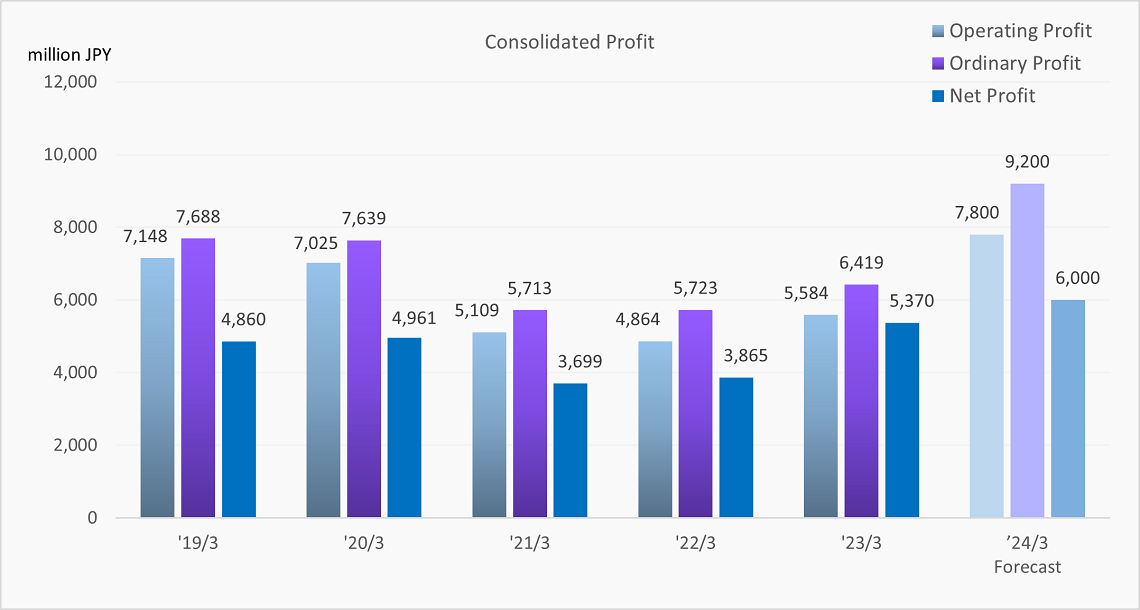
Full Year Consolidated Profit/Loss
*Revenue Recognition and Accounting Standards introduced for March ’22 term.
Consolidated Profit/Loss
Unit: 1 million JPY
| '19/3 | '20/3 | '21/3 | '22/3 | '23/3 | ('24/3 Forecast) | |
|---|---|---|---|---|---|---|
| Sales | 73,732 | 77,668 | 74,147 | 73,595 | 90,643 | 108,000 |
| Gross Margin | 14,169 | 14,079 | 11,806 | 12,066 | 13,037 | ― |
| % of Sales | 19.2% | 18.1% | 15.9% | 16.4% | 14.4% | ― |
| Operating Profit | 7,148 | 7,025 | 5,109 | 4,864 | 5,584 | 7,800 |
| % of Sales | 9.7% | 9.0% | 6.9% | 6.6% | 6.2% | 7.2% |
| Ordinary Profit | 7,688 | 7,639 | 5,713 | 5,723 | 6,419 | 9,200 |
| % of Sales | 10.4% | 9.8% | 7.7% | 7.8% | 7.1% | 8.5% |
| Net Profit for Term | 4,860 | 4,961 | 3,699 | 3,865 | 5,370 | 6,000 |
| % of Sales | 6.6% | 6.4% | 5.0% | 5.3% | 5.9% | 5.6% |
Currency Exchange Rate
Unit: JPY
| End of '19 | End of '20 | End of '21 |
End of '22
|
End of '23 (Assumption) |
|
|---|---|---|---|---|---|
| USD | 109.56 | 103.50 | 115.02 | 132.70 | 141.00 |
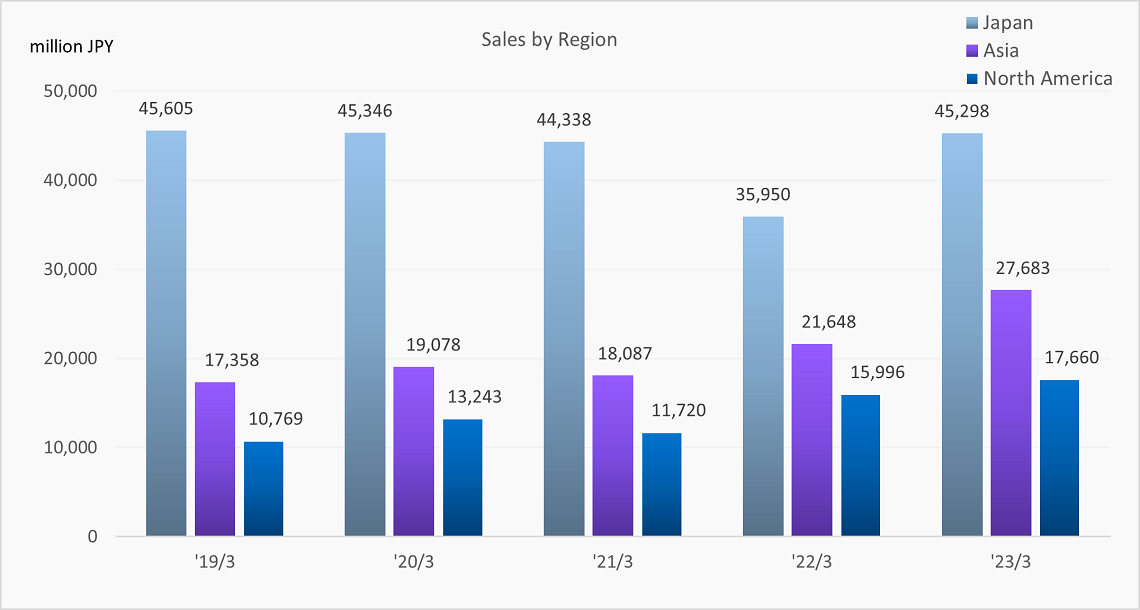
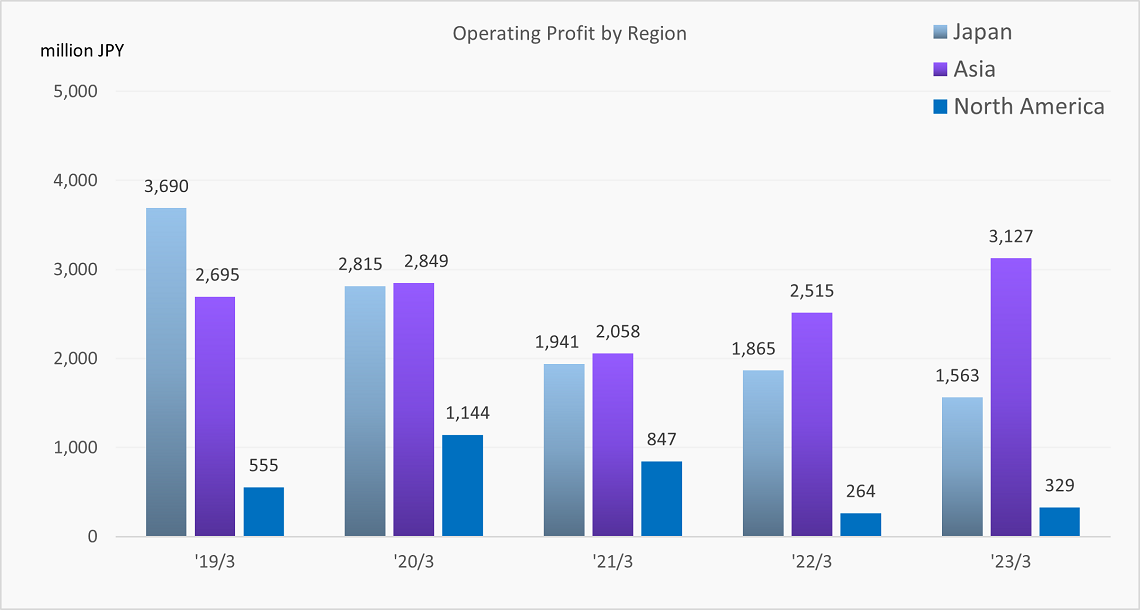
Profit/Loss by Region
*Revenue Recognition and Accounting Standards introduced for March ’22 term.
Profit/Loss by Region
Unit: 1 million JPY
| '19/3 | '20/3 | '21/3 | '22/3 | '23/3 | ||
|---|---|---|---|---|---|---|
| Japan | Sales | 45,605 | 45,346 | 44,338 | 35,950 | 45,298 |
| Operating Profit | 3,690 | 2,815 | 1,941 | 1,865 | 1,563 | |
| % of Sales | 8.1% | 6.2% | 4.4% | 5.2% | 3.5% | |
| Asia | Sales | 17,358 | 19,078 | 18,087 | 21,648 | 27,683 |
| Operating Profit | 2,695 | 2,849 | 2,058 | 2,515 | 3,127 | |
| % of Sales | 15.5% | 14.9% | 11.4% | 11.6% | 11.3% | |
| North America | Sales | 10,769 | 13,243 | 11,720 | 15,996 | 17,660 |
| Operating Profit | 555 | 1,144 | 847 | 264 | 329 | |
| % of Sales | 5.2% | 8.6% | 7.2% | 1.7% | 1.9% |
Consolidated Balance Sheet
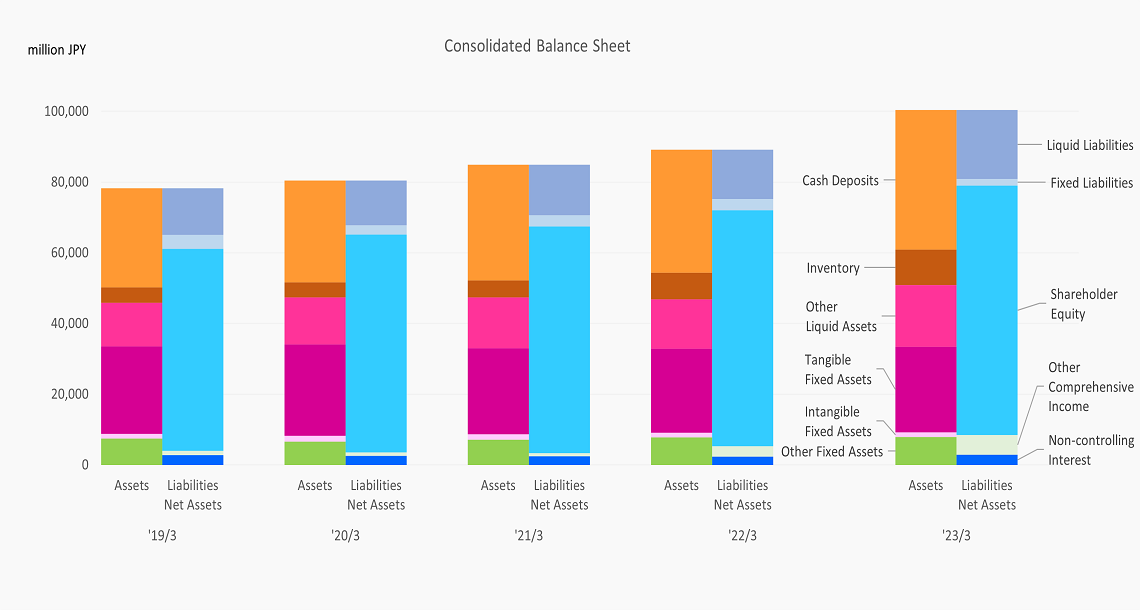
Consolidated Balance Sheet
Unit: 1 million JPY
| '19/3 | '20/3 | '21/3 | '22/3 | '23/3 | |
|---|---|---|---|---|---|
| Cash Deposits | 28,053 | 28,734 | 32,684 | 34,819 | 39,467 |
| Inventory | 4,317 | 4,343 | 4,793 | 7,501 | 9,984 |
| Other Liquid Assets | 12,373 | 13,204 | 14,400 | 14,032 | 17,477 |
| Tangible Fixed Assets | 24,740 | 25,878 | 24,350 | 23,685 | 24,204 |
| Intangible Fixed Assets | 1,381 | 1,650 | 1,454 | 1,400 | 1,360 |
| Other Fixed Assets | 7,430 | 6,614 | 7,190 | 7,759 | 7,865 |
| Total Assets | 78,298 | 80,427 | 84,874 | 89,199 | 100,359 |
| Liquid Liabilities | 13,257 | 12,623 | 14,279 | 13,991 | 19,497 |
| Fixed Liabilities | 3,870 | 2,615 | 3,100 | 3,185 | 1,835 |
| Shareholder Equity | 57,127 | 61,619 | 64,140 | 66,674 | 70,607 |
| Other Comprehensive Income | 1,286 | 961 | 857 | 3,020 | 5,502 |
| Non-controlling Interest | 2,755 | 2,607 | 2,497 | 2,328 | 2,918 |
| Total Liabilities and Assets | 78,298 | 80,427 | 84,874 | 89,199 | 100,359 |
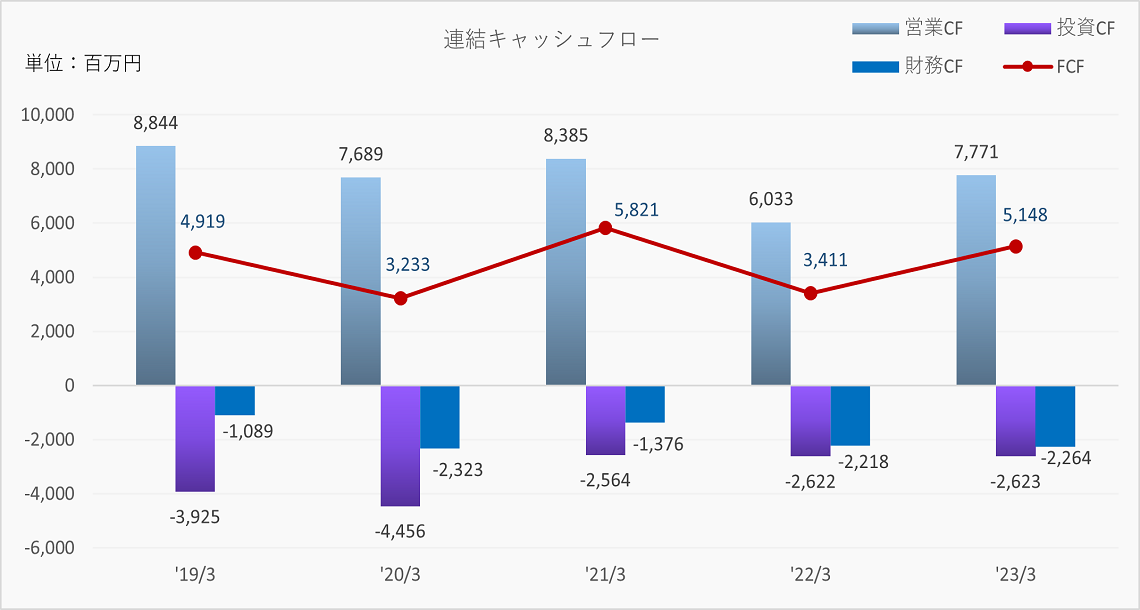
Consolidated Cash Flow
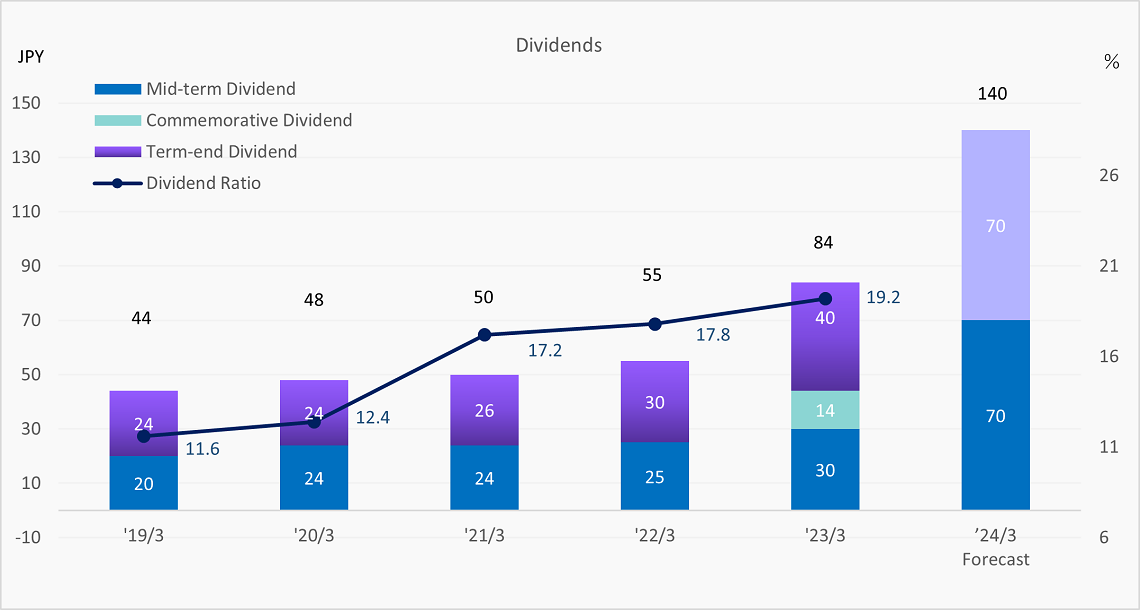
Dividends
Other Indices
Equipment Investments / Depreciation / R&D / Employee Count
Unit: 1 million JPY
| '19/3 | '20/3 | '21/3 | '22/3 | '23/3 | ||
|---|---|---|---|---|---|---|
| Equipment Investments | 4,793 | 5,203 | 2,958 | 2,614 | 3,232 | |
| Depreciation Costs | 3,321 | 3,834 | 4,107 | 4,121 | 3,873 | |
| R&D Expenses | 1,242 | 1,229 | 1,097 | 1,312 | 973 | |
| Employee Count | Consolidated | 2,949 | 3,183 | 3,183 | 3,222 | 3,501 |
| Non-consolidated | 899 | 929 | 950 | 943 | 953 |
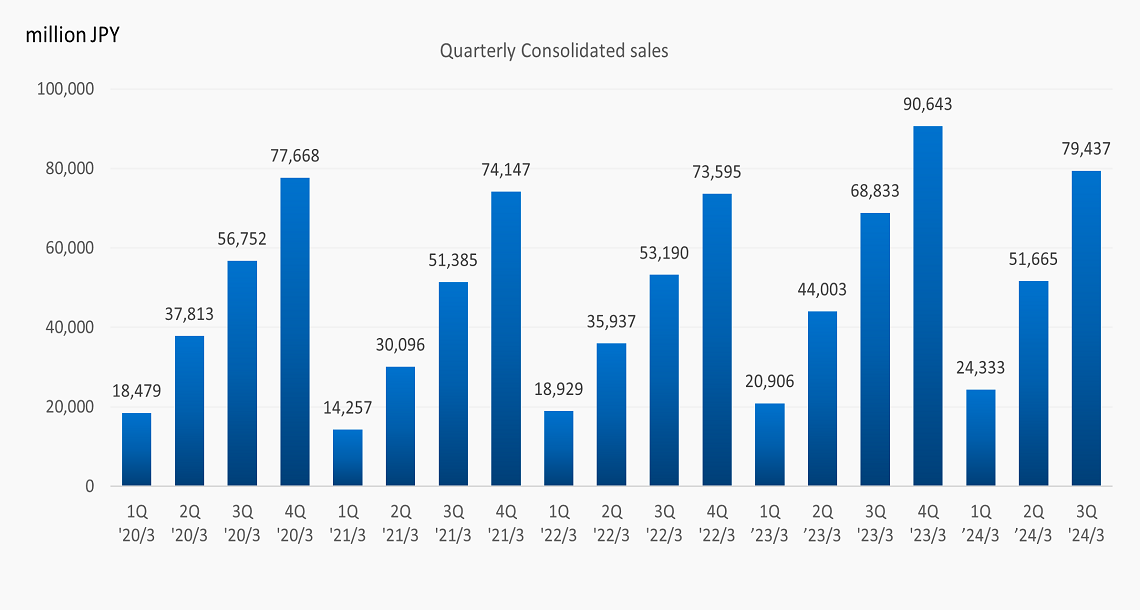
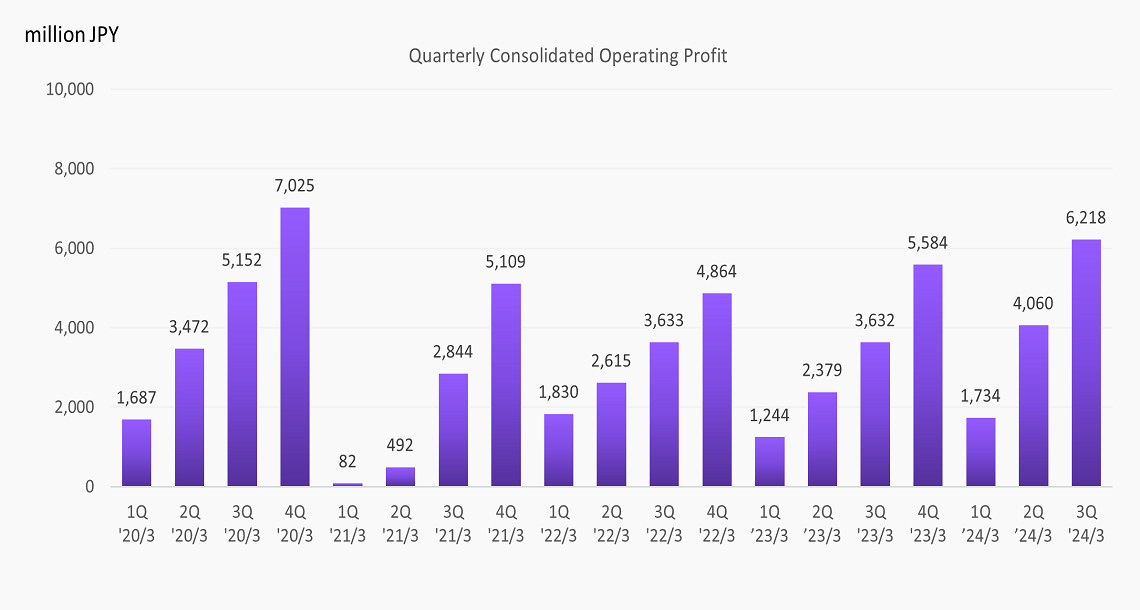
Financial Statement Summary <Quarterly>
Quarterly Consolidated Profit/Loss
*Revenue Recognition and Accounting Standards introduced for March ’22 term.
| '20/3 | '21/3 | '22/3 | '23/3 | '24/3 | |||||||||||||||
|---|---|---|---|---|---|---|---|---|---|---|---|---|---|---|---|---|---|---|---|
| 1Q | 2Q | 3Q | 4Q | 1Q | 2Q | 3Q | 4Q | 1Q | 2Q | 3Q | 4Q | 1Q | 2Q | 3Q | 4Q | 1Q | 2Q | 3Q | |
| USD | 110.99 | 107.79 | 107.92 | 109.56 | 108.83 | 107.74 | 105.80 | 103.50 | 110.71 | 110.58 | 111.92 | 115.02 | 122.39 | 136.68 | 144.81 | 132.70 | 133.53 | 144.99 | 149.58 |