EARNINGS SUMMARY
Financial Statement Summary <Full Year>
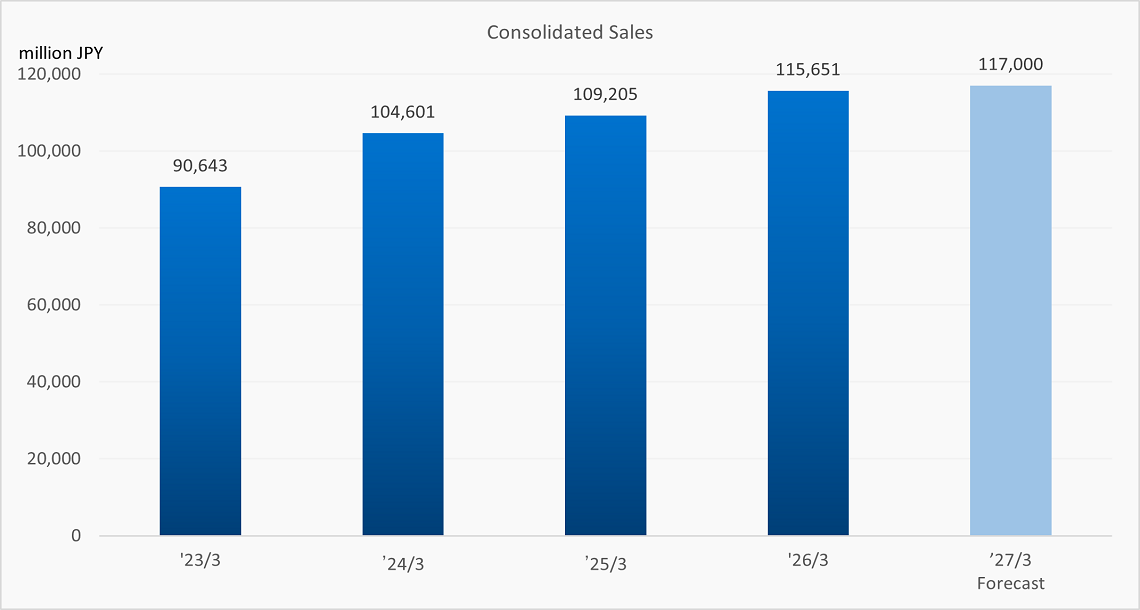
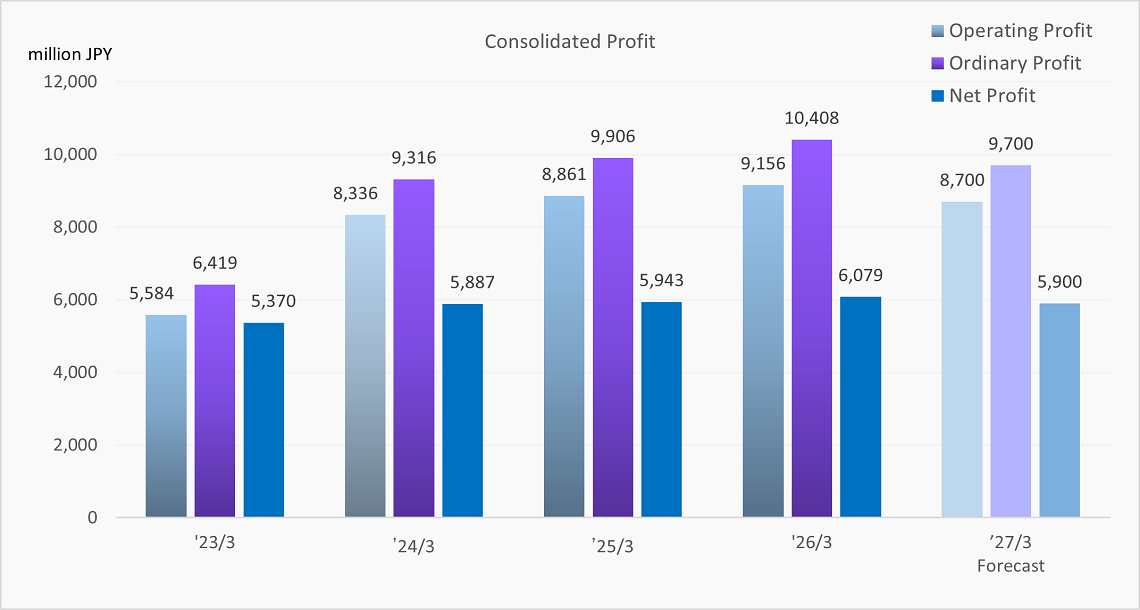
Full Year Consolidated Profit/Loss
*Revenue Recognition and Accounting Standards introduced for March ’22 term.
Consolidated Profit/Loss
Unit: 1 million JPY
| '23/3 | '24/3 | '25/3 | '26/3 | ('27/3 Forecast) | |
|---|---|---|---|---|---|
| Sales | 90,643 | 104,601 | 109,205 | 115,651 | 117,000 |
| Gross Margin | 13,037 | 16,076 | 17,263 | 18,436 | ― |
| % of Sales | 14.4% | 15.4% | 15.8% | 15.9% | ― |
| Operating Profit | 5,584 | 8,336 | 8,861 | 9,156 | 8,700 |
| % of Sales | 6.2% | 8.0% | 8.1% | 7.9% | 7.4% |
| Ordinary Profit | 6,419 | 9,316 | 9,906 | 10,408 | 9,700 |
| % of Sales | 7.1% | 8.9% | 9.1% | 9.0% | 8.3% |
| Net Profit for Term | 5,370 | 5,887 | 5,943 | 6,079 | 5,900 |
| % of Sales | 5.9% | 5.6% | 5.4% | 5.3% | 5.0% |
Currency Exchange Rate
Unit: JPY
|
End of '22
|
End of '23 | End of '24 | End of '25 | End of '26 (Assumption) |
|
|---|---|---|---|---|---|
| USD | 132.70 | 141.83 | 158.18 | 156.56 | 150 |
Profit/Loss by Region
*Revenue Recognition and Accounting Standards introduced for March ’22 term.
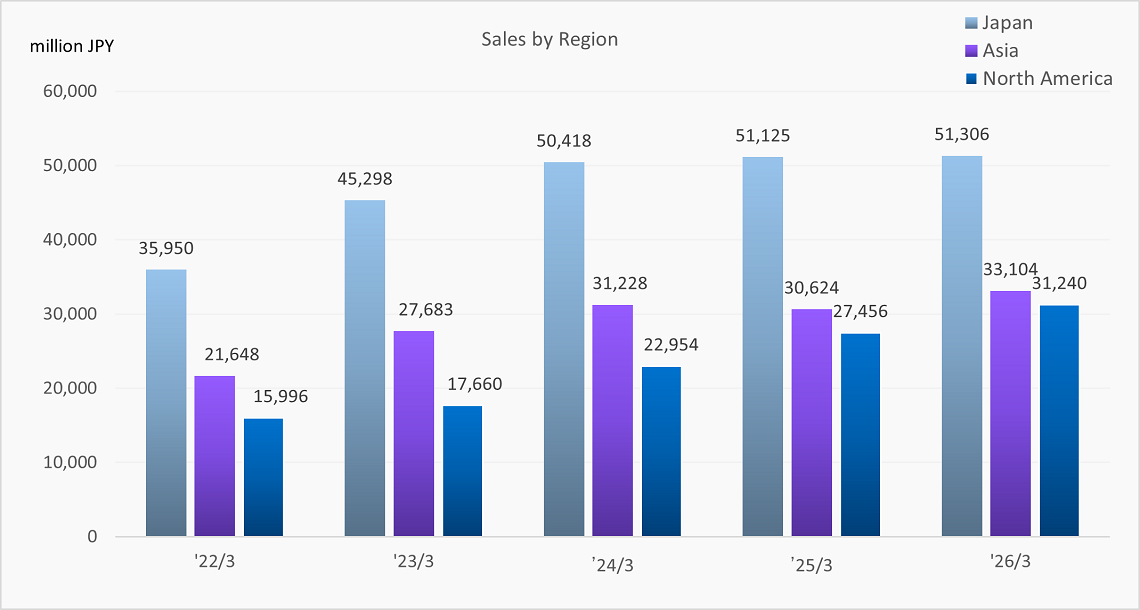
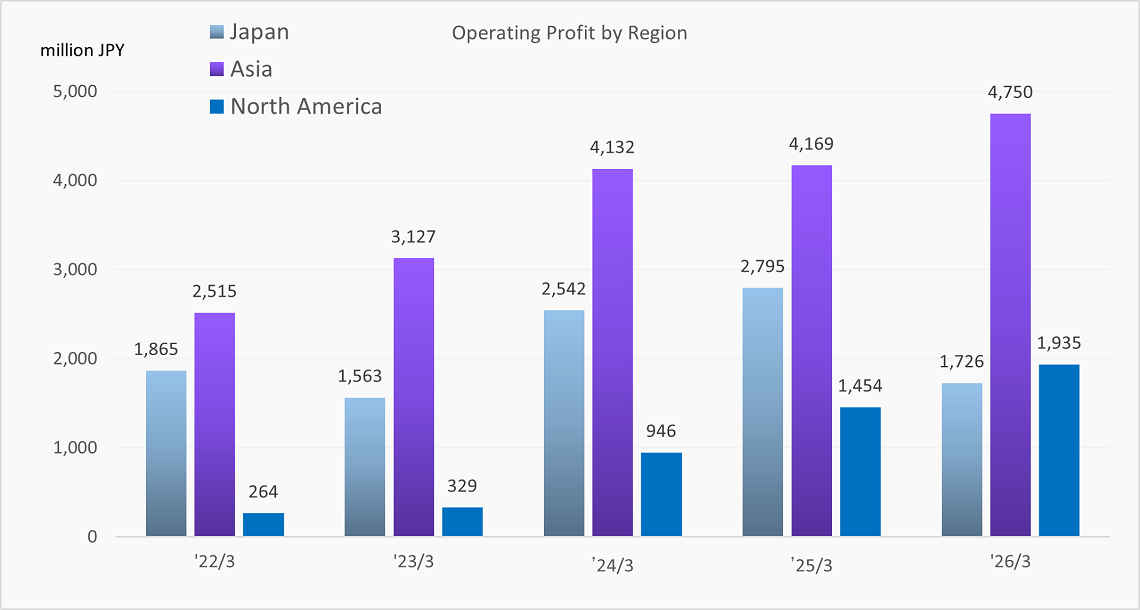
Profit/Loss by Region
Unit: 1 million JPY
| '22/3 | '23/3 | '24/3 | '25/3 | '26/3 | ||
|---|---|---|---|---|---|---|
| Japan | Sales | 35,950 | 45,298 | 50,418 | 51,125 | 51,306 |
| Operating Profit | 1,865 | 1,563 | 2,542 | 2,795 | 1,726 | |
| % of Sales | 5.2% | 3.5% | 5.0% | 5.5% | 3.4% | |
| Asia | Sales | 21,648 | 27,683 | 31,228 | 30,624 | 33,104 |
| Operating Profit | 2,515 | 3,127 | 4,132 | 4,169 | 4,750 | |
| % of Sales | 11.6% | 11.3% | 13.2% | 13.6% | 14.3% | |
| North America | Sales | 15,996 | 17,660 | 22,954 | 27,456 | 31,240 |
| Operating Profit | 264 | 329 | 946 | 1,454 | 1,935 | |
| % of Sales | 1.7% | 1.9% | 4.1% | 5.3% | 6.2% |
Consolidated Balance Sheet
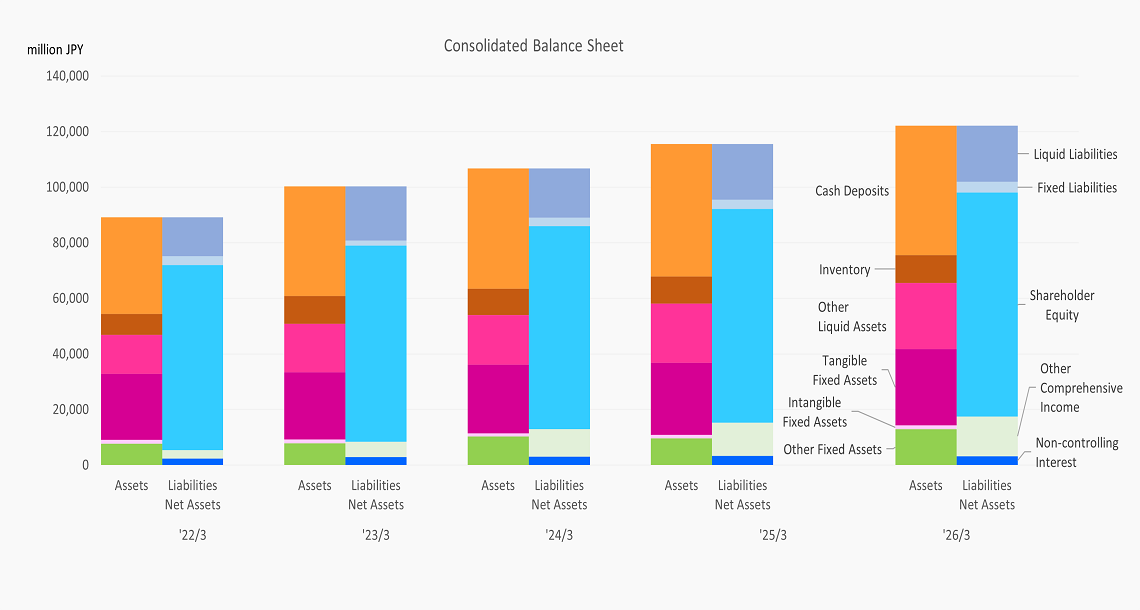
Consolidated Balance Sheet
Unit: 1 million JPY
| '22/3 | '23/3 | '24/3 | '25/3 | '26/3 | |
|---|---|---|---|---|---|
| Cash Deposits | 34,819 | 39,467 | 43,290 | 47,576 | 46,519 |
| Inventory | 7,501 | 9,984 | 9,442 | 9,774 | 10,131 |
| Other Liquid Assets | 14,032 | 17,477 | 17,942 | 21,247 | 23,766 |
| Tangible Fixed Assets | 23,685 | 24,204 | 24,613 | 26,033 | 27,467 |
| Intangible Fixed Assets | 1,400 | 1,360 | 1,222 | 1,176 | 1,302 |
| Other Fixed Assets | 7,759 | 7,865 | 10,301 | 9,716 | 12,997 |
| Total Assets | 89,199 | 100,359 | 106,814 | 115,526 | 122,183 |
| Liquid Liabilities | 13,991 | 19,497 | 17,733 | 20,029 | 20,202 |
| Fixed Liabilities | 3,185 | 1,835 | 3,015 | 3,235 | 3,872 |
| Shareholder Equity | 66,674 | 70,607 | 73,106 | 77,026 | 80,558 |
| Other Comprehensive Income | 3,020 | 5,502 | 9,873 | 11,896 | 14,295 |
| Non-controlling Interest | 2,328 | 2,918 | 3,085 | 3,338 | 3,253 |
| Total Liabilities and Assets | 89,199 | 100,359 | 106,814 | 115,526 | 122,183 |
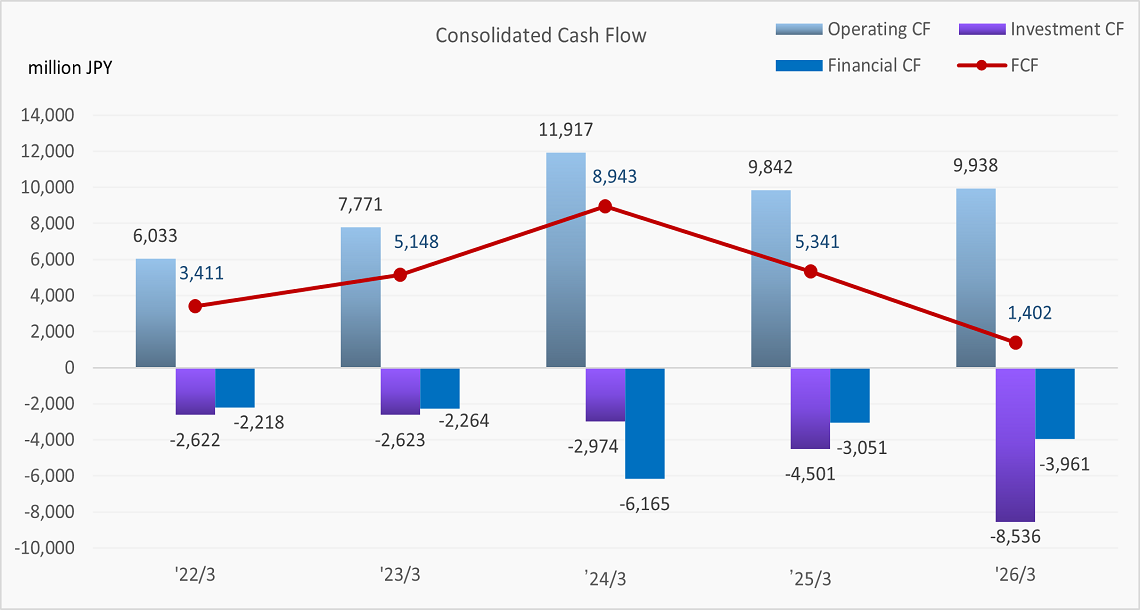
Consolidated Cash Flow
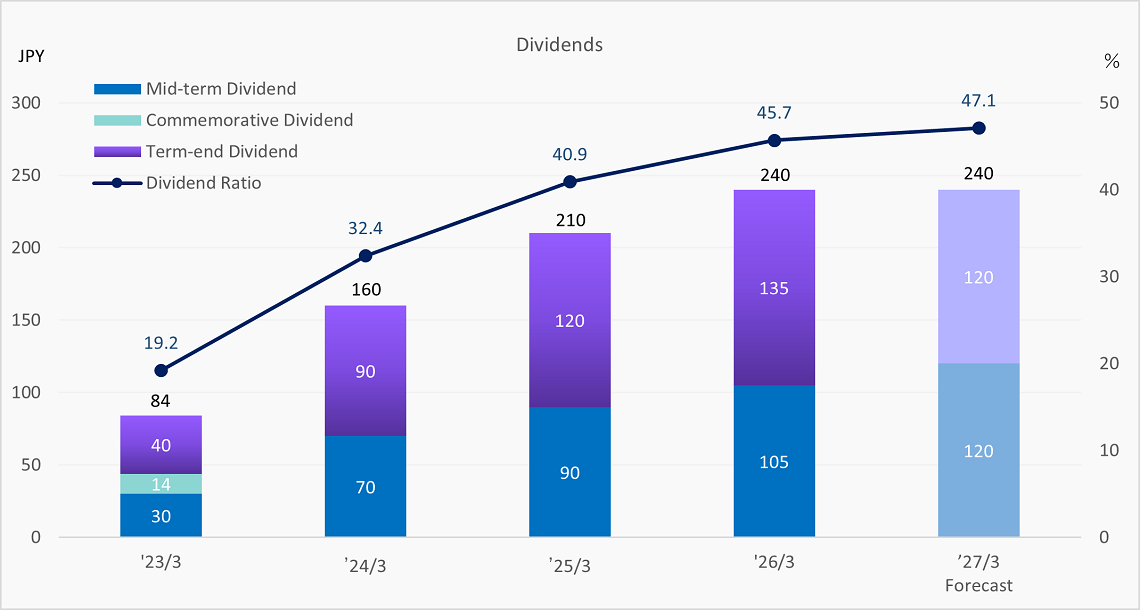
Dividends
Other Indices
Equipment Investments / Depreciation / R&D / Employee Count
Unit: 1 million JPY
| '22/3 | '23/3 | '24/3 | '25/3 | '26/3 | ||
|---|---|---|---|---|---|---|
| Equipment Investments | 2,614 | 3,232 | 3,516 | 4,701 | 5,396 | |
| Depreciation Costs | 4,121 | 3,873 | 4,124 | 4,148 | 4,452 | |
| R&D Expenses | 1,312 | 1,017 | 924 | 1,094 | 1,089 | |
| Employee Count | Consolidated | 3,222 | 3,501 | 3,760 | 3,746 | 3,682 |
| Non-consolidated | 943 | 953 | 954 | 961 | 934 |
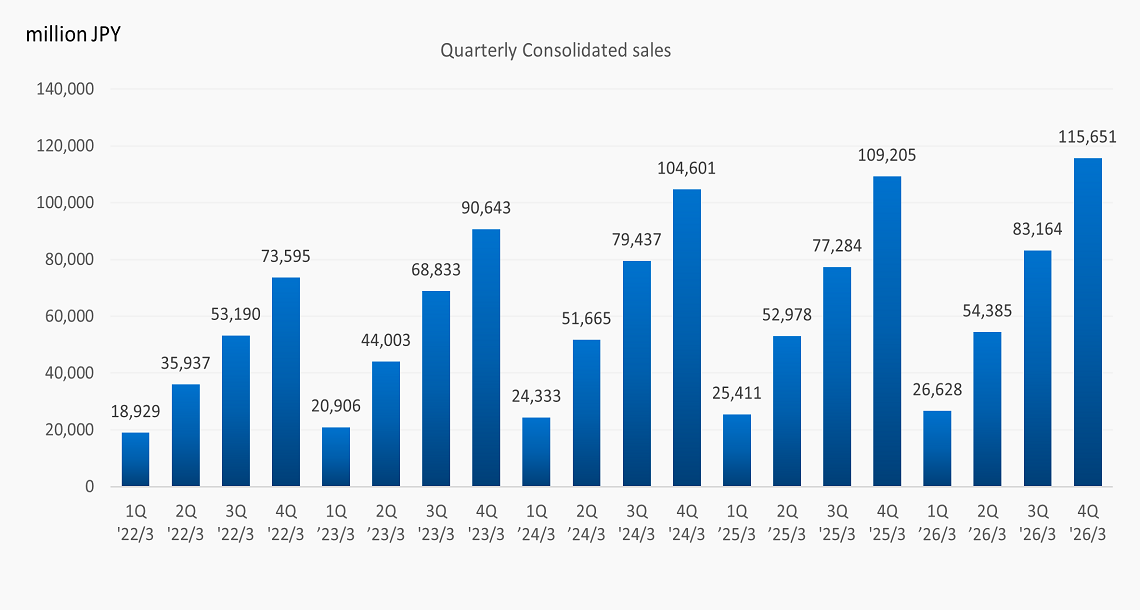
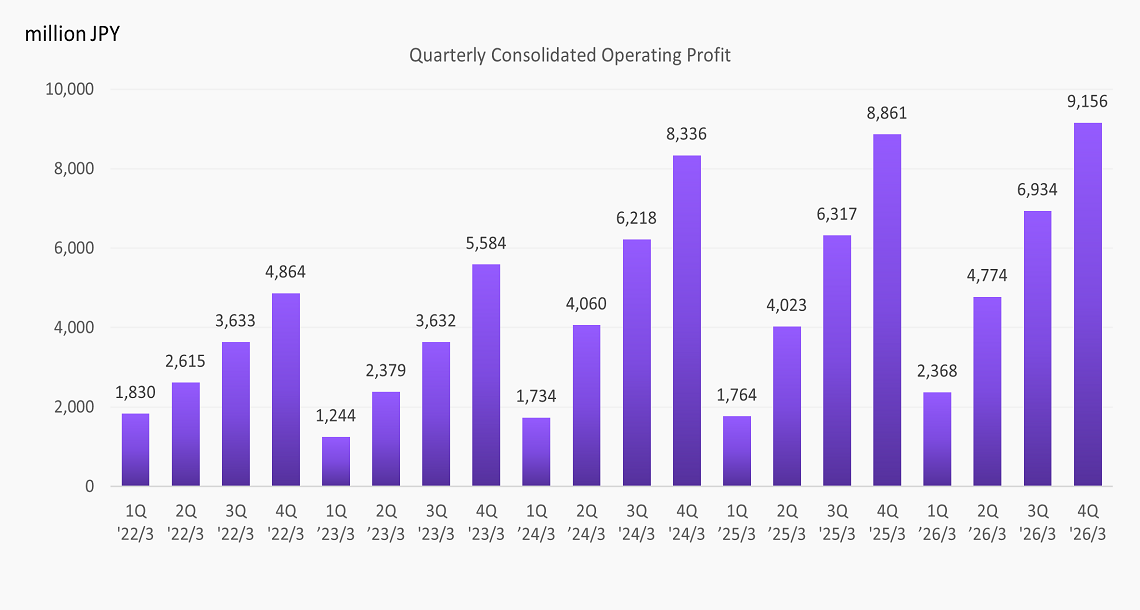
Financial Statement Summary <Quarterly>
Quarterly Consolidated Profit/Loss
*Revenue Recognition and Accounting Standards introduced for March ’22 term.
| '22/3 | '23/3 | '24/3 | '25/3 | '26/3 | ||||||||||||||||
|---|---|---|---|---|---|---|---|---|---|---|---|---|---|---|---|---|---|---|---|---|
| 1Q | 2Q | 3Q | 4Q | 1Q | 2Q | 3Q | 4Q | 1Q | 2Q | 3Q | 4Q | 1Q | 2Q | 3Q | 4Q | 1Q | 2Q | 3Q | 4Q | |
| USD | 110.71 | 110.58 | 111.92 | 115.02 | 122.39 | 136.68 | 144.81 | 132.70 | 133.53 | 144.99 | 149.58 | 141.83 | 151.41 | 161.07 | 142.73 | 158.18 | 149.52 | 144.81 | 148.88 | 156.56 |